Using NI DAQ Express
If you are using the SDH DAQ cart, you can log into the machine as a local user. The login credentials are: username: student password: Passw0rd
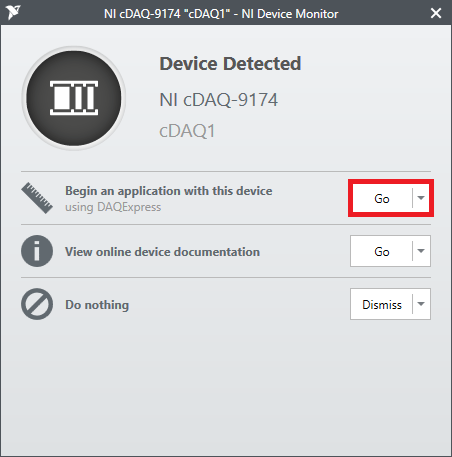
With the functionality of the DAQ established and the load cell now properly wired to the terminal, we can begin to start recording data. To start, when NI DAQExpress records data in the program it is recorded in real time. Having already plugged in the DAQ to the computer, a program called “NI Device monitor” should automatically pop up. Before the program opens, you may need to sign in with your NI User Account, which can be registered at NI’s website at the registration page here. Once completed and having logged in with your account information DAQExpress should now open up. A new window should now pop up saying that the DAQ was detected. Select the “Go” button for the “Begin an application with this device” option.
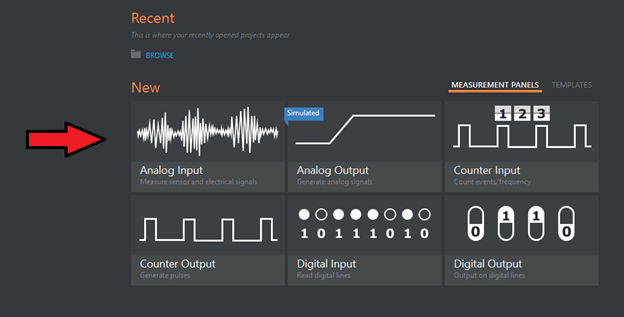
Selecting “Go” will open up the DAQExpress main menu where a new data project can be selected. In our experimental case, since we will be receiving the load data from the load cell as a series of voltage values to the DAQ, we will be selecting “Analog Input” as the project type.
Selecting the project opens up the measurement panel window:
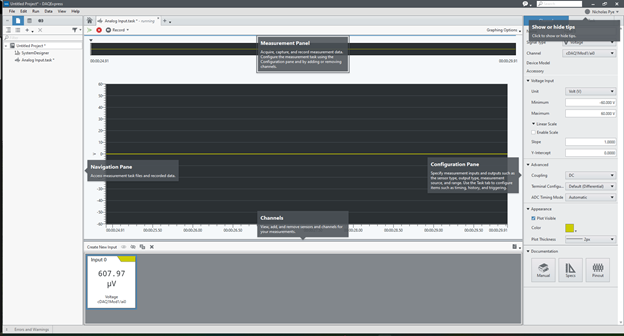
This window will be responsible for monitoring the load output that will be received from the computer by the DAQ and storing it for analysis.
Alternatively, we can instead select “File” in the top left corner, navigate to “New” and select “Project”.
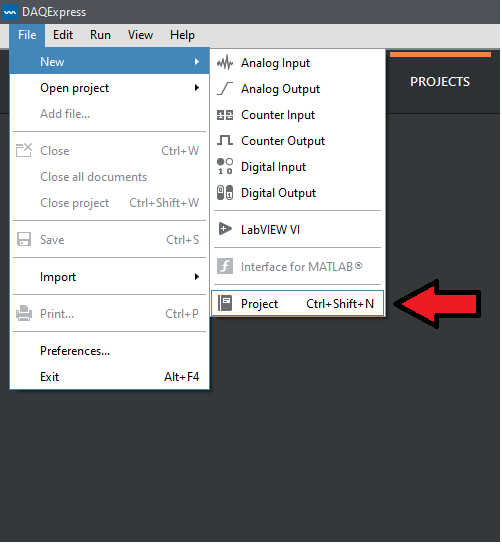
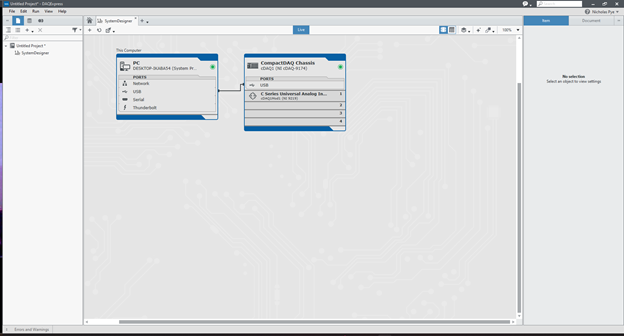
Selecting “New Project” should open up a new untitled project screen where the “SystenDesigner” tab is already opened. This tab provides an excellent opportunity to ensure that all modules as well as the module being used in any measurements are properly installed to the DAQ.
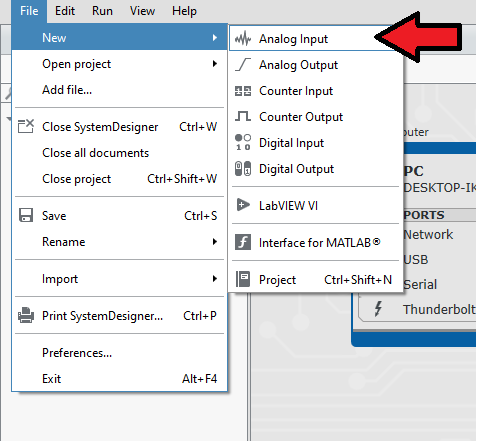
To create a measurement panel, a window can be created by accessing the File function in the top left toolbar (File > New > Analog Input).
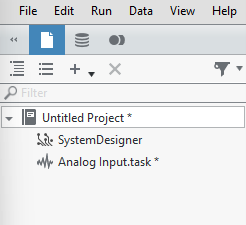
Before beginning to record data from the Load Cell, it’s important to understand all aspects of the input window. This is to ensure that the task is properly configured so that the obtained data is being accurately represented in DAQExpress. First off, on the left we have the Navigation Pane. This pane is responsible for organizing and accessing all current open projects & tasks and can also be accessed to delete tasks, add folders & files within projects.
The middle panel is the Measurement Panel, which is where data is observed, analyzed & recorded in real time.
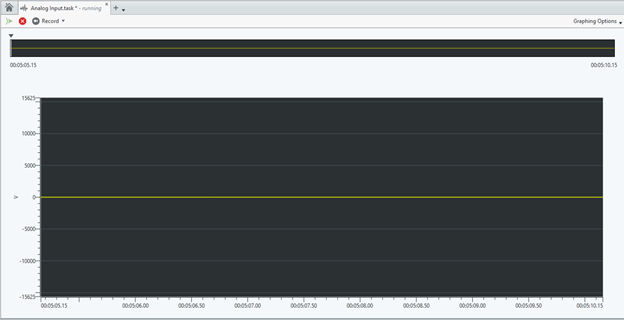
The panel at the bottom is called the input panel and allows you to add additional channels or sensors as new inputs as well as value monitoring for any featured inputs & the option to hide/show specified plots in the measurement pane.

Finally, we have the Configuration Pane. This pane allows a user to specify what type of measurement for an input or output that is being measured using the Channel tab. The channel tab can also make parameter changes to your plot and measuring such as range, input units & plot appearance. The Task tab is used for configuring more advanced graphing options such as timing, triggering & history, Since the parameters in the Task tab are more advanced, we won’t be changing any of the parameters for our setup as the automatically established settings are more than enough for our apparatus.
To configure our apparatus, we will start with the configuration tab by changing our signal type to “Force (Bridge)” in the dropdown menu.
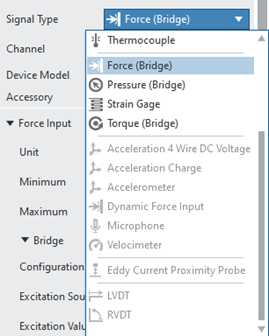
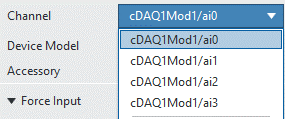
As discussed previously, the modules used in this experiment use channel numbers to distinguish which terminal is in use. In our setup, our load cell has been wired into the Ch. 0 terminal, therefore we should also ensure that the channel being used is channel 0.
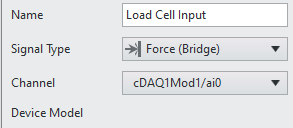
We will also be renaming our input to “Load Cell Input”, which is a good habit to make for organizational purposes if you wish to start running future analyses with multiple sensors.
Next, the Force input will need to be configured. To start, we know that the load cell is rated for 100 lbf. Oftentimes this can be verified using the data sheet, however the sheet for this specific sensor is for the load cell for all available load ranges. To reflect this, force units have been changed to Pound Force (lbf) and the maximum & minimum values have also been changed to -100 & 100 respectively
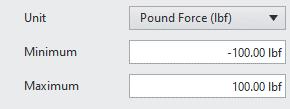
The next set of parameters under “Force” are the “Bridge” parameters. These include parameters for the bridge configuration, excitation value & source, and the nominal resistance.
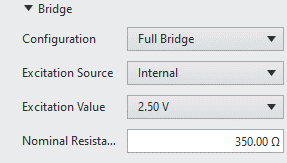
For our load cell, we will be leaving each of these values unchanged. The bridge circuit configuration is a full bridge as we have previously established and the excitation source & values are standardized & unchangeable values in the bridge settings when using force sensors, so we will leave these values as is. Finally we have the nominal resistance which is the mean or average value of the maximum and minimum resistance values in a resistor. In the case of the load cell, we treat nominal resistance as the bridge resistance, which is given in the load cell data sheet to be 350 ohms as already given in the standardized values.

The final set of parameters that will need to be potentially modified are the Sensor Configuration & Calibration parameters, specifically the Radiometric Sensitivity and the Initial Voltage. These values are extremely important to configure correctly, as they can directly impact the force values as they’re displayed in DAQExpress.
Radiometric sensitivity is the sensitivity value that corresponds to the sensor voltage output required to measure a force value of 1 unit given as (mV/V)/N (millivolt per volt per Newton) or (mV/V)/lbf (millivolt per volt per pound-force). Standard sensor sensitivity is the voltage output of the cell at full load, therefore our radiometric sensitivity is actually our sensor sensitivity (3.0 mV/V) divided by load cell’s maximum load value (100 lbf), which is 0.03 (mV/V)/lbf:


Finally, there is also initial voltage to consider. The initial voltage acts as an offset to ensure that all voltage values supplied to DAQExpress from the DAQ read entirely as positive values. We will opt in to including the offset, and therefore deselect the “Remove Initial Voltage” option. We will then select the “Measure Initial Voltage” to allow DAQExpress to calculate & select an initial voltage value for us based on a range of measurements captured within a short span of time. The calculated value should then be automatically added to the initial voltage prompt.
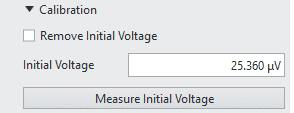
Below the Calibration prompt are two more calibration options, Advanced & Appearance, however we will leave the both topics as default. The Appearance option allows the user to make changes to the plot, such as line color and thickness.
Along with the Channel tab there is also the task tab, which can be used to configure triggering as well as configuring graph timing. We will not be changing any of the timing or trigger settings here, as the default settings are more than adequate for our apparatus. However, in the Time domain graph panel, the “Scale Y axis by channel range” should be toggled on so that the maximum and minimum y-axis values match the maximum & minimum load cell values that were set in the Force input section
Once all of the parameters in the configuration pane have been changed and verified, measurements from the sensor can now be recorded in the measurement pane for analysis. In the top left corner of the measurement pane there are 3 buttons for “Run”, “Stop” & “Record”

The run command allows the user to collect data and analyze it in the measurement pane, but not record the data. This is useful for seeing if your apparatus is performing as expected so that iterations to the setup can be made as needed. To actually record the data the “Record “ button will have to be used, however there are a couple of methods for data recording as seen in the image below.

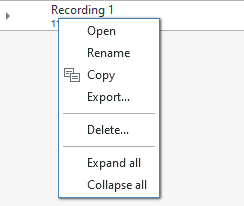
First, hitting the button will allow the program to start freely recording data and will continue until the recording is stopped using the “stop button”. Beginning a data recording will create a data file in the navigation pane that can be saved and reopened at any time or exported to another program like MATLAB or Excel to numerically analyze the data.
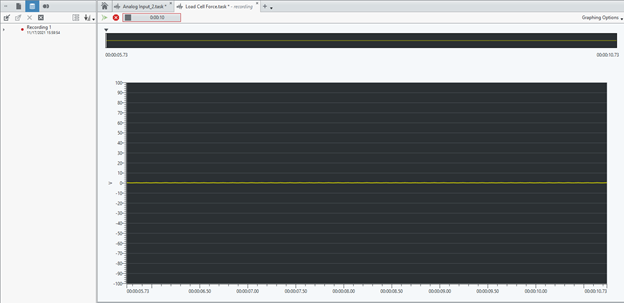
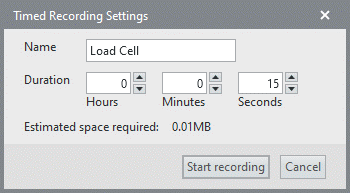
You may also choose to perform a timed recording, which allows the user to measure data for a fixed amount of time. Time settings for the recording can be configured in “Timed Recording Settings upon selecting the times recording prompt.
Finally, there is also the Capture Data option that allows the user to capture a snapshot of continuous data at a specific time interval. The data that is captured in the frame will be the data that is displayed in the measurement pane. The default duration captured is 5 seconds, however the duration of the snapshot can be increased in the “History Duration” setting in the Task tab. Doing so will allow the pane to store more data in the selected time interval.

Shown below is a snapshot of a 20 second capture frame:
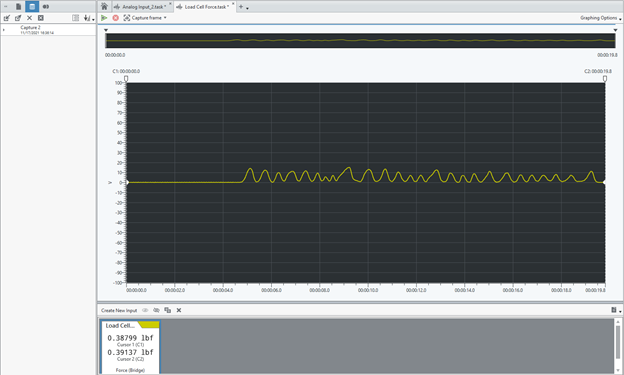
Hovering the cursor over any point in the plot line will provide a readout of the force value at a given specific time in the recording.
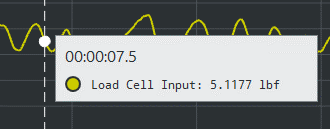
The selected snapshot can also be further refined using the cursors shown at the top of the measurement pane. Using the cursors can change the range of data in the capture frame that we are interested in, which we have done to look at the 7s to 10s range.
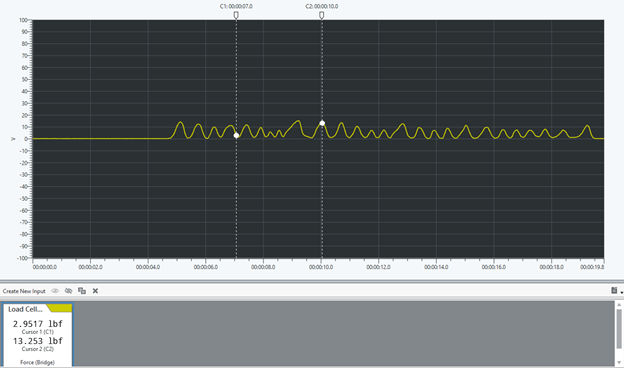
If we are interested in looking at this new time interval in greater detail, there is a second smaller window located right above the measurement pane that includes trim arrows. These arrows can be used to narrow and reduce the data being displayed in the measurement pane.
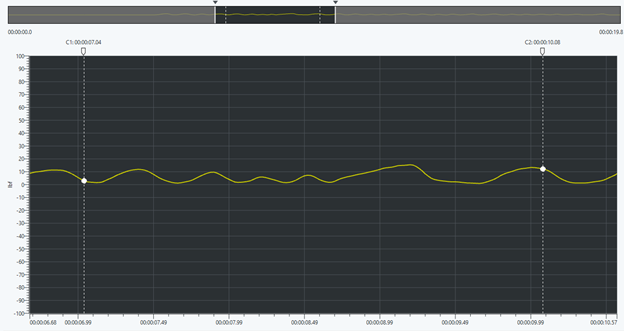
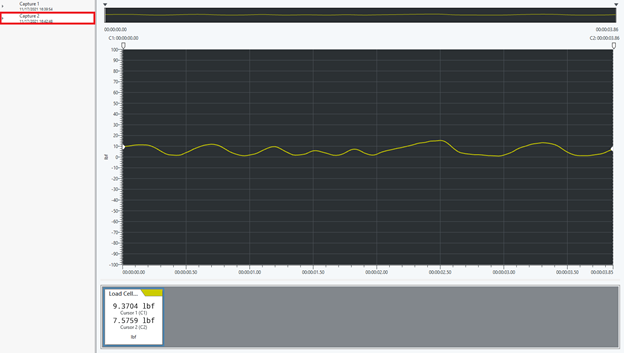
With our data now cropped further down to better show the new 3 second range, the data can also be captured as its own capture frame for further analysis by clicking the “Capture selected data” option in the top left hand corner of the measurement pane.
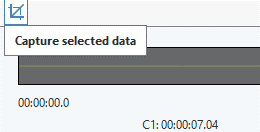
This will save a second capture frame in the Navigation pane containing the data that was just captured. This data can be accessed at a later date or exported & imported using the prompts given at the top of the Navigation pane

