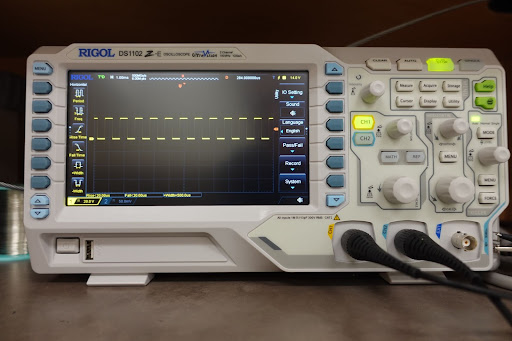
How to use
For this tutorial, an Arduino Uno will be used. For this to work, you must have the Arduino IDE(Integrated Development Network) installed on your computer. An installation guide for the Arduino IDE can be found in Arduino Coding.
Connect the Arduino to a USB(Universal Serial Bus) port using a USB-A to USB-B cable.
Paste the following code in the Arduino IDE:
int digi_pin4 = 4; //declare digital pin 4 to be used
//4 can be changed to whichever pin is desired as long as its a digital pin.
void setup() {
// put your setup code here, to run once:
Serial.begin(9600); //Set the baud(refresh) rate
}
void loop() {
// put your main code here, to run repeatedly:
digitalWrite(digi_pin4, HIGH); //set the output to HIGH
delay(100); //wait with output as HIGH for 100ms
digitalWrite(digi_pin4, LOW); //set the output as LOW
delay(100); //wait with output as LOW for 100ms
}
Turn the Oscilloscope on.
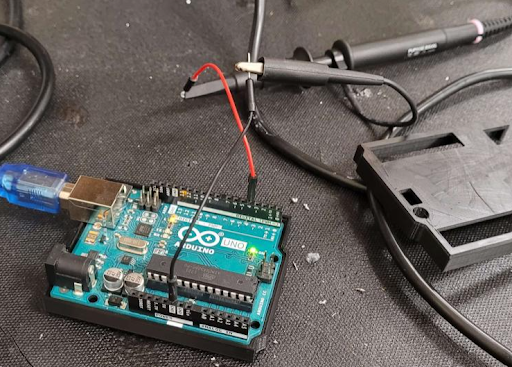
Connect a wire to the GND on the Arduino. Note: Any GND pin on the Arduino works for this. Typically, black or blue wires represent the ground. All DC(Direct Current) circuits have a ground. The ground is the return path for the current as it flows through a circuit.
Connect the ground clip to the wire in step 1.
Connect a wire to digital pin 4 on the Arduino. Note: Typically, red is used to indicate the positive or input of the circuit. The wire can change from digital pin 4, to any other digital pin. However, the code needs to be changed to reflect this.
Connect the oscilloscope probe to the wire in step 3.
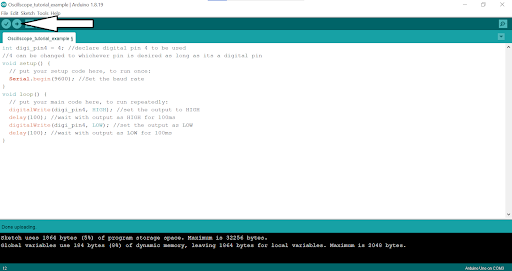
Press the arrow in the top left corner when the code is in the IDE. This arrow will upload the sketch to the Arduino.
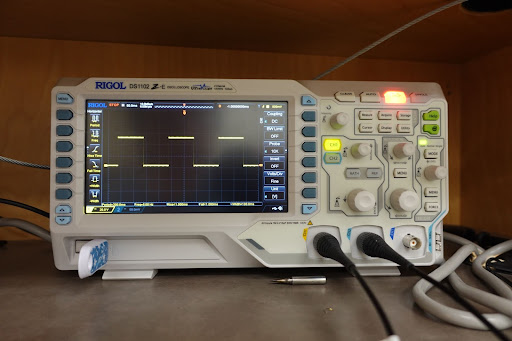
If the oscilloscope is connected, the following waveform will appear on the screen:
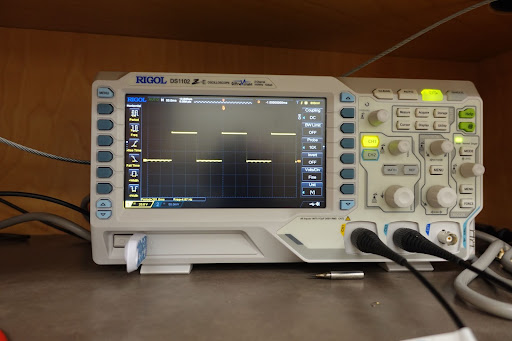
Note: If the signal is moving around, press the RUN/STOP button, so the light is red. This will pause the signal.
The waveform pictured is a square wave generated by the Arduino repeatedly turning port 4 on and off.
Pressing the PRINT button will generate the following image:
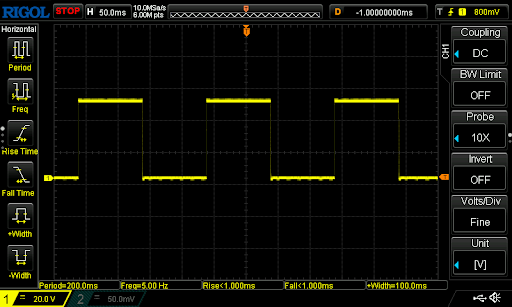
The oscilloscope will show the horizontal measurements section on the left side of the screen. The oscilloscope will show the period and frequency of the waveform at the bottom of the screen.
Note: Pressing the MENU button will switch the measurements horizontally and vertically.
In this case, the period of 200ms makes sense as the code tells the Arduino to output HIGH for 100ms and output LOW for 100ms. Since frequency is the inverse of the period, 1/200ms = 5Hz.
Using the buttons to the left of the screen, we can select different measurements to display. The screen will show these by choosing the rise time, fall time, and width options.
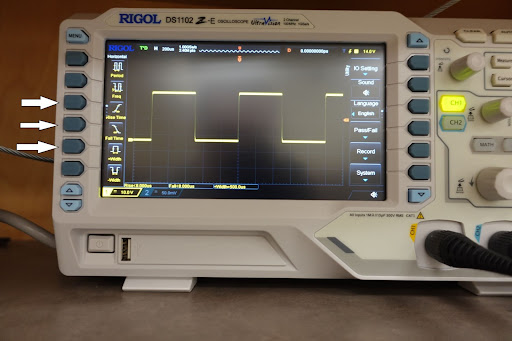
Next, use the vertical position knob to translate the wave such that the bottom of the square lies at y = 0. This will give the following graph.
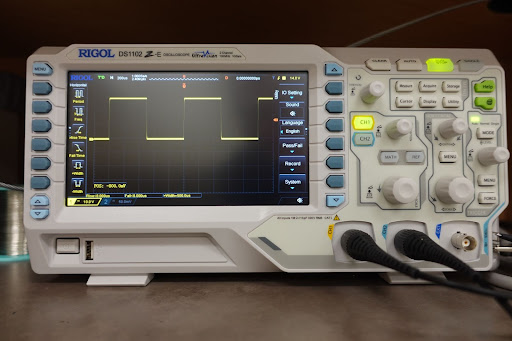
Scale the signal using the vertical scale knob to show the picture below.
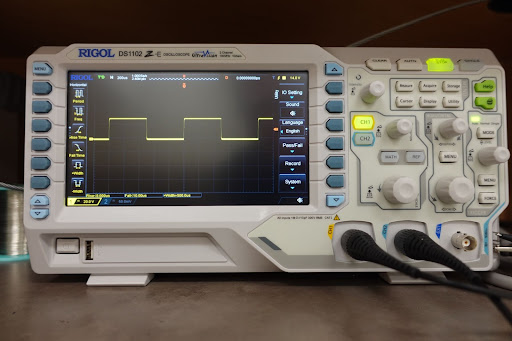
Use the horizontal position knob to translate the signal horizontally.
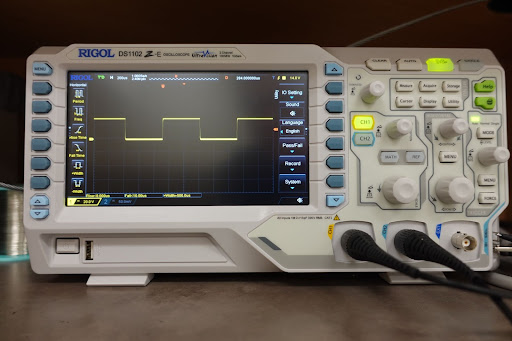
Finally, scale the waveform horizontally.
